
Abstract
- Manufacturing data analytics turns production, operational, enterprise, and business-context data into evidence for monitoring, diagnosis, prediction, and operational decisions.
- Reliable analysis depends on aligning identifiers, time grains, asset hierarchies, KPI definitions, freshness, and lineage across manufacturing systems.
- Common applications include predictive maintenance, quality investigation, throughput analysis, anomaly detection, supply-chain risk, and energy efficiency.
- As AI agents take on more analysis, data access alone is insufficient. They also need governed, reusable context that connects enterprise data, BI logic, and business knowledge.
Ask why output fell on one production line, and you might find the evidence scattered across PLC signals, MES events, maintenance records, ERP orders, BI dashboards, and operator notes. Manufacturers collect huge volumes of data across these systems. The challenge is making those records usable together.
In a recent Manufacturing Leadership Council survey, 63% of manufacturers said they actively analyze or use less than half of their manufacturing data. Yet 89% said data had improved manufacturing decision-making.
One reason for that gap is the difficulty of connecting data, definitions, and operational context across systems. Records from different systems have to correlate to the same assets and production events, while metrics need consistent definitions across the business. Once that groundwork is in place, analytics can put the combined data to work.
What is Manufacturing Data Analytics?
Manufacturing data analytics is the process of using data from across the business to understand production performance and make better operational decisions. Analytics helps manufacturers find production losses that drive avoidable costs and decide where intervention will have the greatest effect.
The analysis often includes:
- BI and reporting provide a view of established KPIs, such as OEE or scrap rate.
- Data mining and machine learning uncover patterns or estimate what may happen next.
Manufacturing analytics is the broader discipline that brings those parts together and translates the findings into an operational decision. AI agents can make those analytical capabilities easier to investigate through natural language, but they still depend on the underlying data, definitions, and analytical logic being correct.
A complete view of production often depends on bringing together high-velocity time-series data (sensor readings, machine states), transactional records (orders, work orders), analytical data (warehouse models, BI datasets), and unstructured or semi-structured information (SOPs, maintenance notes).
For AI workflows, an AI data pipeline also has to ingest, prepare, and deliver those inputs in a form of downstream models that agents can use. That starts with understanding where manufacturing data originates.
Where Manufacturing Analytics Gets Its Data
Manufacturing analytics pulls data upward from the shop floor and connects it with the systems that manage production, quality, maintenance, and the wider business.
At the base is the raw record of what the equipment is doing:
- Machine, control, and OT layer: Sensors, PLCs, SCADA systems, and historians capture machine states, process conditions, alarms, and other time-series data.
Production systems then add the records needed to understand what was happening around those machine conditions:
- Operations layer: MES platforms record production activity such as work execution, routing, changeovers, and work in progress.
- Quality and maintenance layer: QMS and CMMS platforms add inspection results, nonconformance records, maintenance history, failure codes, and work orders.
The enterprise level connects that production activity to the wider business:
- Enterprise layer: ERP and supply-chain systems contribute production orders, inventory, purchasing data, supplier information, and schedules.
Finally, the analytics layer organizes those records for reporting and investigation:
- Analytics and context layer: Warehouses, lakes, BI models, dashboards, SOPs, spreadsheets, and other operational documents provide analytical structure and business context.
Teams also have to reconcile asset IDs, time grains, equipment hierarchies, lot-to-SKU mappings, and metric definitions across systems.

The 4 Types of Manufacturing Data Analytics
The four types of manufacturing analytics answer different questions as teams move from monitoring performance toward investigation and prediction.
Descriptive Analytics: What Happened?
Descriptive analytics summarizes past or current performance. Teams might compare OEE, downtime, yield, scrap, cycle time, or output across lines, shifts, or SKUs.
Diagnostic Analytics: Why Did It Happen?
Diagnostic analytics investigates what contributed to a change in performance. A drop in quality, for example, might be traced to a specific supplier lot.
Predictive Analytics: What Is Likely to Happen?
Historical run rates, downtime patterns, changeover times, and the upcoming order schedule might indicate that Line 2 is unlikely to have enough capacity to meet next week’s demand for a high-volume SKU.
Prescriptive Analytics: What Should We Evaluate Next?
Prescriptive analytics weighs possible responses against operating constraints. If demand is expected to exceed capacity, the analysis can help determine which production sequence makes the best use of available capacity.
6 Manufacturing Data Analytics Use Cases and Examples
1. Predictive Maintenance
Predictive maintenance uses equipment condition data to catch developing failures before they cause unplanned downtime and the higher repair and production costs that tend to follow.
Question: Which assets are showing signs of an approaching failure?
Data: Vibration and temperature readings, maintenance work orders, and equipment failure history.
Example: A motor’s vibration begins following the same pattern recorded before earlier bearing failures, prompting maintenance to inspect the bearing before the next scheduled PM window.
2. Quality and Defect Root-Cause Analysis
Quality and defect root-cause analysis helps manufacturers narrow down the factors most likely to be driving scrap or rising defect rates so corrective action can be aimed at the right process condition.
Question: What changed when the defect rate increased?
Data: Inspection results, nonconformance records, machine settings, supplier-lot data, and shift or SKU context.
Example: A scrap spike appears across several runs, but the affected units all trace back to one material lot processed on the same machine after a setup change.
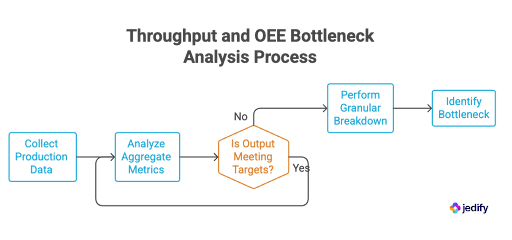
3. Throughput and OEE Bottleneck Analysis
Throughput analysis helps manufacturers pinpoint where a line is losing output, even when top-level performance metrics look normal.
Question: Which part of the process is limiting throughput?
Data: OEE data, cycle times, stoppage logs, changeover records, and production volume by line, shift, or SKU.
Example: A line is meeting its overall OEE target, but output for a high-volume SKU keeps falling short. Breaking cycle time down by station shows one workstation consistently running above its target cycle time.
4. Process Anomaly Detection
Process anomaly detection can catch subtle shifts that are not yet causing a problem or crossing an alarm threshold, but may still lead to defects or downtime
Question: Which process conditions are moving away from normal operating behavior?
Data: Temperature, pressure, flow, machine-state data, and historical production outcomes.
Example: On an injection molding line, cavity pressure falls as fill time rises. Neither reading crosses an alarm threshold, but the pattern is still abnormal and has preceded short-shot defects.
5. Inventory and Supply-Chain Risk
Supply-chain analytics shows how a shortage or supplier delay will affect upcoming production, giving planners time to adjust the schedule.
Question: Which scheduled orders depend on the delayed material, and when will available inventory run short?
Data: Production plans, ERP inventory, purchase orders, supplier lead times, and logistics events.
Example: A component shipment is delayed five days. Inventory and schedule data show when stock will run out and which two lines will be affected, so planners can move other work forward.
6. Energy and Resource Efficiency
Energy analytics identifies where power is consumed without producing value, exposing conditions that drive up energy costs.
Question: Where is resource use unusually high for the amount of production taking place?
Data: Machine or line energy use, operating state, production output, idle time, and product mix.
Example: Energy use stays high on a packaging line after production stops for the night. Comparing consumption with line status traces the excess draw to compressed-air equipment that continues running during idle hours.
Why Manufacturing Data Analytics Breaks: 5 Common Challenges
Each of these use cases depends on combining data from several systems without losing the definitions and relationships needed to interpret it. That is where manufacturing analytics programs often become difficult to scale.
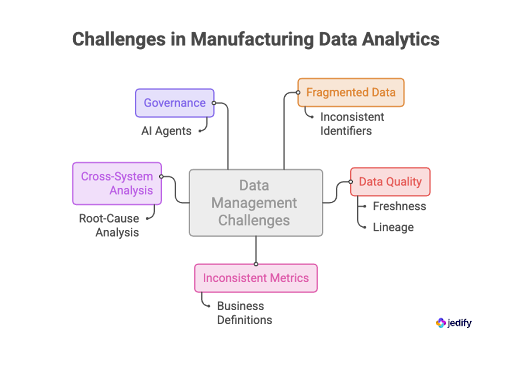
1. Fragmented Data and Inconsistent Identifiers
The same machine, supplier, lot, or SKU may be represented differently across MES, ERP, CMMS, QMS, and analytical systems. Asset hierarchies conflict, and lot-to-SKU mappings vary between plant and enterprise systems. Combining these data sources for analysis requires deliberate integration work to reconcile those mismatches.
2. Data Quality, Freshness, and Lineage
NIST’s 2026 roadmap points to data quality and effective data management as ongoing challenges in smart manufacturing. Missing machine events skew calculations, while delayed refreshes leave analysis lagging behind current plant conditions. Teams need sufficiently complete, current data, plus lineage back to the source records and calculation logic behind each metric.
3. Inconsistent Metrics and Business Definitions
Imagine one site excludes planned cleaning from downtime, while another counts it. If KPI definitions are not standardized, comparisons across dashboards or plants become unreliable. Leaders cannot tell whether a performance gap is real or the result of different calculation rules.
4. Cross-System Root-Cause Analysis
Even with integrated data, root-cause analysis is difficult because the relationships between systems are not always explicit.
For example, understanding a yield drop may require machine history, MES production records, maintenance events, quality results, ERP context, BI logic, and operational documentation. Some of that evidence may already sit in warehouses or lakes, while the logic needed to interpret it remains distributed across BI tools and documents. Analysts then have to reconstruct those relationships for each investigation.
The goal is not simply to connect those systems. It is to give agents one live model of how assets, production events, KPIs, operating rules, and business processes relate.
5. Governance Becomes More Important With AI Agents
AI agents need business rules as well as access to manufacturing data. They need to know which definitions apply and how records from different systems relate.
As agents take on more analysis, data teams need to govern that context alongside the underlying data. Definitions, relationships, and business rules need to stay reviewable and reusable as sources change.
Make Manufacturing Analytics Decision-Ready
Manufacturing teams get more reliable analysis when they connect the right evidence, standardize what it means, and preserve traceability to the source data and calculation logic behind each finding.
AI agents make that foundation more important. Access to MES records, ERP data, maintenance history, or warehouse tables does not tell an agent how those records relate, which OEE or downtime definition applies, or which operating rules govern a particular plant. Without shared context, data teams end up rebuilding those mappings and definitions for each new agent or workflow.
Jedify is the Context Graph for enterprise AI. It gives AI agents a living, company-specific model of the data, definitions, relationships, and business knowledge they need to reason accurately across manufacturing systems. Semantic Fusion™ autonomously builds and maintains that Context Graph by bringing together operational data, existing BI and reporting logic, and business knowledge from documents and other enterprise sources.
Data teams can review and update that context as schemas and definitions change, then deliver it to AI agents and applications through Jedify’s contextual MCP server or SDK. The same governed definitions can support root-cause investigations and other agent-driven workflows without hardcoding manufacturing logic into every application.
Book a demo with Jedify can turn fragmented manufacturing data, BI logic, and operational knowledge into a shared Context Graph for your AI agents.